Agentic AI Production Deployment Patterns: Canary Rollouts, Shadow Mode & Fallback Chains
Deploying an AI agent to production is not like deploying a microservice. Your agent can perform perfectly on evaluation datasets and catastrophically on a small segment of real user traffic. This guide covers battle-tested deployment patterns — canary rollouts, shadow mode, fallback chains, and Kubernetes-native patterns — so you can ship AI agents with the confidence your users deserve.
TL;DR
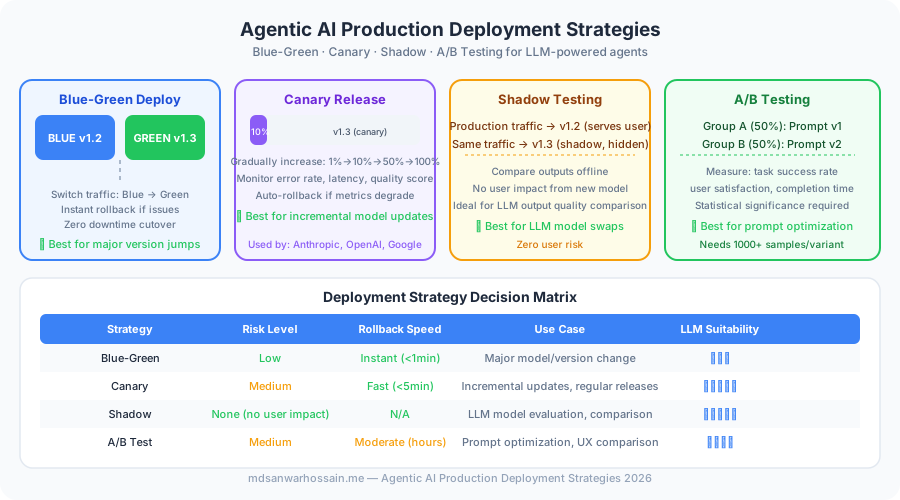
"Never flip an AI agent from 0% to 100% traffic. Use shadow mode first (parallel run, no user impact), then 1% canary with automated quality gates, then ramp gradually. Always have a hard fallback to a deterministic implementation. Monitor hallucination rate and user satisfaction — not just error rate."
Table of Contents
- Why AI Agent Deployment Is Different
- Shadow Mode: The Safest First Step
- Canary Rollouts with Quality Gates
- Blue-Green Deployments for Agent Models
- Fallback Chains & Circuit Breakers
- Kubernetes Patterns for AI Agents
- Observability: What to Monitor in Production
- Rate Limiting & Quota Management
- Automated Rollback Triggers
- Production Readiness Checklist
1. Why AI Agent Deployment Is Different
Traditional software deployments fail in binary, detectable ways — a 500 error, a null pointer exception, a timeout. AI agents fail in ways that are subtle, probabilistic, and sometimes only visible through user behavior: a subtly wrong response, a hallucinated fact a user trusts, a multi-step workflow that completes but produces the wrong business outcome.
- Silent degradation: A new model version may score 2% worse on your eval set. Your HTTP error rate stays at 0%. But user satisfaction drops 15% over two weeks because responses are subtly less helpful.
- Distribution shift: Your agent performs well on your eval traffic distribution. Real production traffic has edge cases you never anticipated.
- Prompt injection: Adversarial users craft inputs that hijack your agent's instructions. You cannot test for all injection vectors in advance.
- Vendor model updates: GPT-4o receives a silent update from OpenAI. Your agent's behavior changes without you deploying anything.
- Latency spikes under load: Your agent's P99 latency triples under production load because the LLM API rate-limits and your retry logic compounds delays.
These characteristics demand a deployment philosophy borrowed from chaos engineering: assume failure, test in production safely, and automate rollback based on behavioral signals — not just infrastructure metrics.
2. Shadow Mode: The Safest First Step
Shadow mode (dark launching) runs your new AI agent in parallel with your existing system, using real production traffic, but discards the agent's output without showing it to users. This gives you production-quality behavioral data with zero user risk.
# Shadow mode router — runs both old and new agent, returns old result
import asyncio, logging
logger = logging.getLogger(__name__)

class ShadowModeRouter:
    def __init__(self, production_agent, shadow_agent, shadow_enabled=True):
        self.production = production_agent
        self.shadow = shadow_agent
        self.shadow_enabled = shadow_enabled

    async def handle(self, request: dict):
        prod_result = await self.production.run(request)
        if self.shadow_enabled:
            asyncio.create_task(self._run_shadow(request, prod_result))
        return prod_result

    async def _run_shadow(self, request, prod_result):
        try:
            shadow_result = await self.shadow.run(request)
            logger.info("shadow_comparison", extra={
                "request_id": request.get("id"),
                "agreement": self._outputs_agree(prod_result, shadow_result),
            })
        except Exception as e:
            logger.error(f"Shadow agent error (non-impacting): {e}")

    def _outputs_agree(self, prod, shadow) -> bool:
        # Use semantic similarity (cosine) or LLM-as-judge in production
        return True
Run shadow mode for at least 1 week. Only proceed to canary when the shadow agent meets your quality bar (>90% semantic agreement, error rate <1%) on real production traffic.
3. Canary Rollouts with Quality Gates
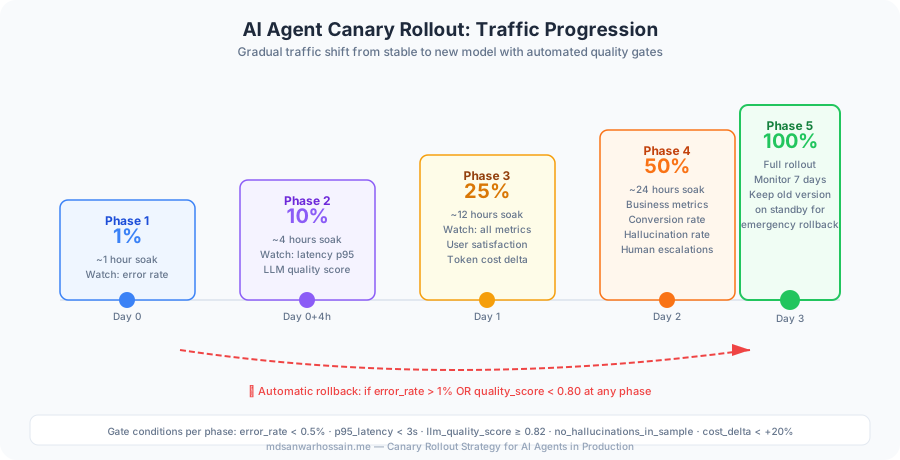
After shadow mode passes, route a small slice of real traffic to the new agent while routing the majority to the stable version. Automate rollout progression based on quality gates — not just elapsed time:
- Phase 1 — 1% traffic: Run for 48 hours. Gate on: error rate <0.5%, P99 latency <5s, thumbs-down rate <5%.
- Phase 2 — 10% traffic: Run for 72 hours. Gate on: CSAT score delta <2%, hallucination rate <3%, cost per session within 20% of baseline.
- Phase 3 — 50% traffic: Run for 5 days. All Phase 2 metrics stable, no P0 incidents attributed to new agent.
- Phase 4 — 100% traffic: Full rollout. Keep old agent warm for 2 weeks for emergency rollback.
# Canary quality gate (run as automated check in CI or cron)
from dataclasses import dataclass

@dataclass
class CanaryMetrics:
    error_rate: float
    p99_latency_ms: float
    thumbs_down_rate: float
    hallucination_rate: float
    cost_per_session_usd: float

@dataclass
class CanaryGate:
    max_error_rate: float = 0.005
    max_p99_ms: float = 5000
    max_thumbs_down: float = 0.05
    max_hallucination: float = 0.03
    max_cost: float = 0.50

    def passes(self, m: CanaryMetrics) -> tuple[bool, list[str]]:
        failures = []
        if m.error_rate > self.max_error_rate:
            failures.append(f"error_rate {m.error_rate:.2%} > limit")
        if m.p99_latency_ms > self.max_p99_ms:
            failures.append(f"P99 {m.p99_latency_ms}ms > limit")
        if m.thumbs_down_rate > self.max_thumbs_down:
            failures.append(f"thumbs_down {m.thumbs_down_rate:.2%} > limit")
        if m.hallucination_rate > self.max_hallucination:
            failures.append(f"hallucination {m.hallucination_rate:.2%} > limit")
        return len(failures) == 0, failures
4. Blue-Green Deployments for Agent Models
Blue-green deployments maintain two identical production environments. Blue serves 100% of traffic; green is the new version being validated. A single load-balancer flip switches all traffic. For AI agents, keep blue warm for 2 weeks — not hours — because quality degradation can take days to surface in user behavior metrics.
This pattern is especially valuable when switching underlying models (GPT-4o → o3), when your agent has stateful dependencies (vector stores) that must be migrated atomically, or when regulations require full auditability of which version served at each timestamp.
5. Fallback Chains & Circuit Breakers
Every AI agent in production needs a fallback chain — a cascade of degraded-but-reliable alternatives when the primary agent fails or exceeds SLA thresholds:
# Fallback chain with circuit breaker pattern
import time
from enum import Enum

class CircuitState(Enum):
    CLOSED = "closed"
    OPEN = "open"
    HALF_OPEN = "half_open"

class CircuitBreaker:
    def __init__(self, failure_threshold=5, timeout_seconds=60):
        self.failure_count = 0
        self.failure_threshold = failure_threshold
        self.timeout = timeout_seconds
        self.state = CircuitState.CLOSED
        self.last_failure_time = None

    def call(self, fn, *args, **kwargs):
        if self.state == CircuitState.OPEN:
            if time.time() - self.last_failure_time > self.timeout:
                self.state = CircuitState.HALF_OPEN
            else:
                raise Exception("Circuit OPEN — using fallback")
        try:
            result = fn(*args, **kwargs)
            self.failure_count = 0
            self.state = CircuitState.CLOSED
            return result
        except Exception:
            self.failure_count += 1
            self.last_failure_time = time.time()
            if self.failure_count >= self.failure_threshold:
                self.state = CircuitState.OPEN
            raise

class AgentFallbackChain:
    # Tier 1: Full agent -> Tier 2: Lightweight agent -> Tier 3: Deterministic rules
    def __init__(self):
        self.primary_cb = CircuitBreaker(failure_threshold=3, timeout_seconds=30)
        self.secondary_cb = CircuitBreaker(failure_threshold=5, timeout_seconds=60)

    def handle(self, request: dict) -> dict:
        try:
            return self.primary_cb.call(self.primary_agent, request)
        except Exception:
            pass
        try:
            return self.secondary_cb.call(self.secondary_agent, request)
        except Exception:
            pass
        return {"response": "Service temporarily degraded. Please try again shortly.",
                "source": "deterministic_fallback", "degraded": True}
6. Kubernetes Patterns for AI Agents
AI agents have unique resource profiles requiring Kubernetes configuration tuned to their workload:
- CPU/Memory sizing: Agent orchestration pods are I/O-bound (waiting on LLM APIs). Request 0.5–1 CPU, 512MB memory. Self-hosted LLMs need GPU nodes (A10G or A100).
- KEDA autoscaling: Scale on queue depth (SQS, Kafka, Redis Streams) rather than CPU. This correctly models agent workload — idle during LLM inference, busy during tool execution.
- Graceful shutdown: Set
terminationGracePeriodSeconds: 120and implement SIGTERM handlers that drain the active task queue before shutdown. - Secret management: Use Kubernetes External Secrets Operator with AWS Secrets Manager, Vault, or GCP Secret Manager. Never inject API keys as plaintext env vars.
- Network policies: Restrict egress from agent pods to only required LLM API endpoints. Agents with broad internet access are prompt-injection + SSRF risks.
# kubernetes/agent-deployment.yaml (key sections)
apiVersion: apps/v1
kind: Deployment
metadata:
  name: ai-agent
spec:
  replicas: 3
  strategy:
    type: RollingUpdate
    rollingUpdate:
      maxUnavailable: 0
      maxSurge: 1
  template:
    spec:
      terminationGracePeriodSeconds: 120
      containers:
      - name: agent
        image: my-agent:v2.1.0
        resources:
          requests: {cpu: "500m", memory: "512Mi"}
          limits:   {cpu: "2000m", memory: "2Gi"}
        env:
        - name: OPENAI_API_KEY
          valueFrom:
            secretKeyRef:
              name: llm-secrets
              key: openai-api-key
        readinessProbe:
          httpGet: {path: /health, port: 8080}
          initialDelaySeconds: 10
          periodSeconds: 5
        lifecycle:
          preStop:
            exec:
              command: ["/bin/sh", "-c", "sleep 10"]
7. Observability: What to Monitor in Production
AI agent observability requires metrics beyond traditional infrastructure monitoring. Instrument these five categories from day one:
| Metric Category | Key Metrics | Alert Threshold |
|---|---|---|
| Infrastructure | Error rate, P99 latency, pod restarts | error >1%, P99 >8s |
| LLM Quality | Hallucination rate, refusal rate, output length distribution | hallucination >5% |
| User Signals | Thumbs up/down rate, session abandonment, retry rate | thumbs-down >10% |
| Cost | Token spend per session, daily total, cache hit rate | daily >120% of baseline |
| Security | Prompt injection attempts, output filter triggers, PII leakage flags | Any PII leakage = P0 |
Use Langfuse, LangSmith, or Helicone for LLM-specific observability (traces, evaluations, cost tracking) alongside your standard infrastructure monitoring (DataDog, Grafana, Prometheus).
8. Rate Limiting & Quota Management
LLM APIs enforce rate limits in tokens per minute (TPM) and requests per minute (RPM). Without agent-layer rate limiting, a single traffic spike can exhaust your entire quota, causing all users to hit 429 errors simultaneously.
- Per-user token bucket: Redis-backed token bucket per user. Refill rate = your LLM quota / active user count. Prevents any single user from monopolizing capacity.
- Global quota sentinel: A sidecar process monitors real-time TPM usage. At 80% of quota, it throttles new non-priority requests and enables queuing mode.
- Priority queuing: Premium user requests skip the queue. Background/batch tasks are automatically deferred when quota is constrained.
- Exponential backoff with jitter: On 429 responses, back off with jitter to prevent thundering herd when the rate limit window resets.
9. Automated Rollback Triggers
Configure automated rollback triggers that shift traffic back to the stable version without human intervention:
- Error rate spike: If error rate exceeds 2% over a 5-minute window, automatically roll back and page on-call.
- Latency SLA breach: If P99 latency exceeds 10 seconds for 3 consecutive minutes, roll back.
- Quality score drop: A continuous eval sampler sends 1% of production traffic through an LLM judge. If quality score drops >10% below the stable baseline, trigger rollback.
- Cost runaway: If hourly token spend exceeds 3× baseline, freeze the new version and alert. A prompt injection attack or agent loop bug can cause massive cost spikes without triggering error rate alarms.
10. Production Readiness Checklist
- ✅ Shadow mode tested for ≥1 week with >90% agreement rate on real traffic
- ✅ Canary rollout plan with explicit quality gates per phase (1% → 10% → 50% → 100%)
- ✅ Fallback chain: full agent → lightweight agent → deterministic fallback
- ✅ Circuit breaker configured with failure thresholds per tier
- ✅ Kubernetes graceful shutdown with terminationGracePeriodSeconds: 120
- ✅ API keys via External Secrets Operator (not plaintext env vars)
- ✅ Egress network policy restricting agent pods to LLM API endpoints only
- ✅ Per-user rate limiting with Redis token bucket
- ✅ Global TPM sentinel alerting at 80% quota consumption
- ✅ Automated rollback on error rate, latency, quality score, and cost
- ✅ LLM judge sampling 1% of production traffic continuously
- ✅ Dashboards for all 5 observability categories: infra, quality, user, cost, security
11. Infrastructure Architecture for Production AI Agents
Running AI agents in production demands infrastructure decisions that differ substantially from typical microservices workloads. GPU availability, large model artifact storage, long-running request timeouts, and per-request token budgets all require purpose-built Kubernetes configurations. The following patterns address the most common infrastructure gaps teams encounter when first deploying LLM-powered agents to production at scale.
A production Kubernetes deployment for an AI agent service with GPU node pool scheduling and model-serving sidecars:
# agent-deployment.yaml
apiVersion: apps/v1
kind: Deployment
metadata:
  name: order-assistant-agent
  namespace: ai-agents
spec:
  replicas: 4
  selector:
    matchLabels:
      app: order-assistant-agent
  template:
    metadata:
      labels:
        app: order-assistant-agent
        version: "2.1.0"
    spec:
      nodeSelector:
        # Schedule on GPU nodes only for local model inference
        accelerator: nvidia-a10g
      tolerations:
        - key: "nvidia.com/gpu"
          operator: "Exists"
          effect: "NoSchedule"
      containers:
        - name: agent
          image: registry.example.com/order-assistant:2.1.0
          resources:
            requests:
              cpu: "2"
              memory: "8Gi"
              nvidia.com/gpu: "1"
            limits:
              cpu: "4"
              memory: "16Gi"
              nvidia.com/gpu: "1"
          env:
            - name: OPENAI_API_KEY
              valueFrom:
                secretKeyRef:
                  name: llm-api-credentials
                  key: openai-key
            - name: TOKEN_BUDGET_PER_REQUEST
              value: "4096"
            - name: MAX_AGENT_ITERATIONS
              value: "10"
          # Extended timeout for multi-step agent workflows
          livenessProbe:
            httpGet:
              path: /actuator/health/liveness
              port: 8080
            initialDelaySeconds: 60
            periodSeconds: 30
            timeoutSeconds: 10
          readinessProbe:
            httpGet:
              path: /actuator/health/readiness
              port: 8080
            initialDelaySeconds: 30
            periodSeconds: 10
          terminationGracePeriodSeconds: 120  # drain in-flight agent workflows
---
# Horizontal Pod Autoscaler based on GPU memory utilisation
apiVersion: autoscaling/v2
kind: HorizontalPodAutoscaler
metadata:
  name: order-assistant-agent-hpa
  namespace: ai-agents
spec:
  scaleTargetRef:
    apiVersion: apps/v1
    kind: Deployment
    name: order-assistant-agent
  minReplicas: 2
  maxReplicas: 20
  metrics:
    - type: Resource
      resource:
        name: cpu
        target:
          type: Utilization
          averageUtilization: 60
    - type: External
      external:
        metric:
          name: agent_queue_depth
          selector:
            matchLabels:
              app: order-assistant-agent
        target:
          type: AverageValue
          averageValue: "5"  # scale up if queue depth exceeds 5 per pod
For high-throughput scenarios where you need a dedicated model server rather than embedding the model inside the agent container, deploy vLLM as a separate service and route agent inference requests through it. vLLM provides PagedAttention for efficient KV-cache management, continuous batching, and OpenAI-compatible API endpoints that require zero agent code changes:
# vllm-deployment.yaml — shared model server for multiple agent services
apiVersion: apps/v1
kind: Deployment
metadata:
  name: vllm-llama3-70b
  namespace: ai-inference
spec:
  replicas: 2
  template:
    spec:
      containers:
        - name: vllm
          image: vllm/vllm-openai:v0.4.2
          args:
            - "--model"
            - "meta-llama/Meta-Llama-3-70B-Instruct"
            - "--tensor-parallel-size"
            - "4"        # shard across 4 GPUs
            - "--max-model-len"
            - "8192"
            - "--gpu-memory-utilization"
            - "0.90"
          resources:
            limits:
              nvidia.com/gpu: "4"
12. Monitoring and Alerting for AI Agents in Production
Standard infrastructure metrics — CPU, memory, request rate, error rate — are necessary but insufficient for AI agents. An agent can show 0 % HTTP error rate while producing consistently unhelpful responses. You need a second tier of LLM-specific signals: token consumption, model latency percentiles, quality score distributions, tool-call failure rates, and agent iteration depths.
Custom Prometheus metrics for LLM agent observability in Spring Boot with Micrometer:
@Component
public class AgentMetricsRecorder {
    private final MeterRegistry registry;
    private final Counter tokenUsageCounter;
    private final Timer agentLatencyTimer;
    private final DistributionSummary qualityScoreDistribution;
    private final Counter toolCallFailureCounter;

    public AgentMetricsRecorder(MeterRegistry registry) {
        this.registry = registry;
        this.tokenUsageCounter = Counter.builder("llm.token.usage.total")
            .tag("model", "gpt-4o")
            .tag("type", "prompt")           // or "completion"
            .description("Total tokens consumed by LLM calls")
            .register(registry);

        this.agentLatencyTimer = Timer.builder("agent.workflow.duration")
            .publishPercentiles(0.5, 0.90, 0.99)
            .publishPercentileHistogram()
            .description("End-to-end agent workflow latency")
            .register(registry);

        this.qualityScoreDistribution = DistributionSummary
            .builder("agent.response.quality.score")
            .publishPercentiles(0.1, 0.5, 0.9)
            .description("LLM-judge quality scores (0.0 – 1.0)")
            .register(registry);

        this.toolCallFailureCounter = Counter.builder("agent.tool.call.failures")
            .tag("tool", "unknown")
            .description("Number of failed tool invocations")
            .register(registry);
    }

    public void recordAgentExecution(AgentResult result) {
        tokenUsageCounter.increment(result.getPromptTokens());
        agentLatencyTimer.record(result.getDurationMs(), TimeUnit.MILLISECONDS);
        qualityScoreDistribution.record(result.getQualityScore());
        if (result.hasToolCallFailure()) {
            registry.counter("agent.tool.call.failures",
                "tool", result.getFailedToolName()).increment();
        }
    }
}
Alerting rules for AI agent SLOs (Prometheus AlertManager format):
For Grafana dashboard setup, use the Grafana AI/LLM Observability dashboard template (community ID 19004) as a starting point. Add panels for: token usage by model and endpoint, quality score heatmap over time, agent iteration depth distribution (to catch runaway agents), and a cost-per-request trend line correlated with deployment version.
13. Cost Management: Controlling LLM API Spend at Scale
LLM API costs are fundamentally different from infrastructure costs: they scale with request complexity, not server count. A single agent workflow that spawns multiple tool calls and several model inference steps can cost 50× more than a simple classification request. Without active cost controls, a single runaway agent or a sudden traffic spike can exhaust a monthly API budget in hours.
The most effective cost control strategy is model routing by task complexity — automatically selecting the cheapest model capable of handling each request type:
Semantic caching with Redis is the highest-ROI cost optimisation for agents that handle repetitive queries. Unlike exact-match caching, semantic caching uses vector similarity to match semantically equivalent questions and serve cached responses without any model invocation:
@Service
public class SemanticCacheService {
    private final EmbeddingModel embeddingModel;
    private final RedisTemplate<String, CachedResponse> redisTemplate;
    private static final double SIMILARITY_THRESHOLD = 0.95;
    private static final Duration CACHE_TTL = Duration.ofHours(4);

    public Optional<String> getCachedResponse(String query) {
        float[] queryEmbedding = embeddingModel.embed(query);
        // Search Redis vector index using RediSearch (redis-py-vectors or Jedis)
        List<ScoredCacheEntry> candidates = searchByVector(queryEmbedding, topK: 5);
        return candidates.stream()
            .filter(e -> e.getCosineSimilarity() >= SIMILARITY_THRESHOLD)
            .max(Comparator.comparingDouble(ScoredCacheEntry::getCosineSimilarity))
            .map(ScoredCacheEntry::getCachedResponse);
    }

    public void cacheResponse(String query, String response) {
        float[] embedding = embeddingModel.embed(query);
        String cacheKey = "semantic:" + UUID.randomUUID();
        CachedResponse entry = new CachedResponse(query, response, embedding);
        redisTemplate.opsForValue().set(cacheKey, entry, CACHE_TTL);
        // Store vector in Redis HNSW index for approximate nearest-neighbour search
        storeVector(cacheKey, embedding);
    }
}
Teams that implement semantic caching consistently report 20–40 % reduction in LLM API spend for customer-facing agents with repetitive query distributions. Combine semantic caching with token budget enforcement (reject or truncate requests that would exceed a per-user daily token cap) and per-endpoint spend alerts to build a comprehensive cost-management layer.
14. Incident Response for AI Agent Failures
AI agent incidents differ from traditional service incidents in one critical way: by the time an alert fires, the agent may already have taken irreversible actions — sent emails, submitted orders, or modified database records — that need to be assessed and potentially reversed. Your incident response runbook must account for the agent's action history, not just its current health state.
Runbook structure for AI agent incidents:
- Step 1 — Contain (0–2 min): Activate the circuit breaker to stop new agent invocations. Route incoming requests to the deterministic fallback system. This prevents the faulty agent from taking additional actions while you investigate.
- Step 2 — Assess impact (2–10 min): Query the agent action log to enumerate all actions taken since the anomaly began. Classify each action as reversible (query only), potentially harmful (state mutation), or irreversible (external API calls). Escalate immediately if irreversible harmful actions are detected.
- Step 3 — Identify root cause (10–20 min): Check the four most common AI agent failure modes in order: (a) model API degradation or version change, (b) prompt injection via user input, (c) tool endpoint failure causing runaway retries, (d) context window overflow causing hallucination.
- Step 4 — Remediate: Roll back to the previous agent version, adjust circuit-breaker thresholds, or patch the affected tool endpoint. Do not re-enable the agent until a shadow-mode comparison confirms the fix.
Circuit breaker implementation for Spring Boot agent services using Resilience4j, with a fallback that switches to a deterministic rule-based system:
@Service
public class AgentCircuitBreakerService {

    @CircuitBreaker(
        name = "llmAgent",
        fallbackMethod = "deterministicFallback"
    )
    @TimeLimiter(name = "llmAgent")  // 30-second timeout per agent invocation
    public CompletableFuture<AgentResponse> invokeAgent(AgentRequest request) {
        return CompletableFuture.supplyAsync(() ->
            agentExecutor.execute(request));
    }

    // Fallback: deterministic rule-based system for critical workflows
    public CompletableFuture<AgentResponse> deterministicFallback(
            AgentRequest request, Throwable ex) {
        log.warn("LLM agent circuit open, using deterministic fallback. cause={}",
                 ex.getMessage());
        metricsRecorder.incrementFallbackActivations();
        return CompletableFuture.supplyAsync(() ->
            deterministicRuleEngine.process(request));
    }
}

# Resilience4j circuit breaker configuration in application.yml
resilience4j:
  circuitbreaker:
    instances:
      llmAgent:
        slidingWindowType: COUNT_BASED
        slidingWindowSize: 20
        failureRateThreshold: 30          # open after 30% failure rate
        slowCallRateThreshold: 50         # also open on slow calls
        slowCallDurationThreshold: 25s    # calls taking >25s are "slow"
        waitDurationInOpenState: 30s
        permittedNumberOfCallsInHalfOpenState: 3
        automaticTransitionFromOpenToHalfOpenEnabled: true
  timelimiter:
    instances:
      llmAgent:
        timeoutDuration: 30s
        cancelRunningFuture: true
The deterministicRuleEngine fallback is the single most important reliability investment for production AI agents. It ensures your application continues to function — at reduced intelligence — even when the LLM API is completely unavailable. Design it to handle the top 20 % of query types that account for 80 % of your traffic, and configure circuit-breaker open/close notifications to go to both your on-call channel and your product team so they know when the fallback is active.
Related Posts
Leave a Comment
Md Sanwar Hossain
Software Engineer · Java · Spring Boot · Microservices · AI/LLM Systems